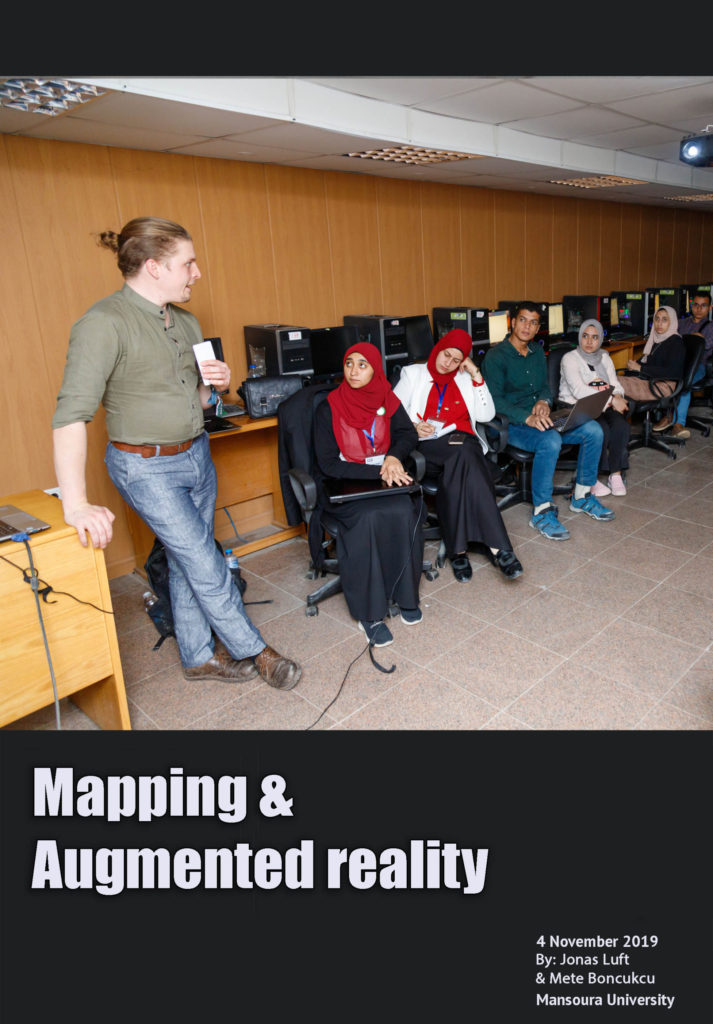
Directed by: Jonas Luft and Mete Boncukcu researchers at the City Science Lab in Hafen city university, Hamburg.
– The workshop dealt with the definition and discussion about QGIS. In the beginning, the discussion took place about the function of the program to record all the data that related to the city from the streets and buildings (educational, health, residential, ….), and made it available on the Internet and therefore can be consulted at any time.
– After that, the discussion was about the possibility of entering geographic information using Google Earth in the form (maps, aerial photographs, satellite images, descriptive information (names and tables)) and processing this information, storage, analysis (spatial analysis and statistical analysis) and then presented it in the form of Maps, Reports and Charts.
– Then, it was practically experimented with the help of lecturers by identifying a study area on Google Earth and inserting it on QGIS, then drawing the existing buildings with polygons above them to be used to extract maps showing mass, space, movement paths in the study area and other maps showing population density and Others.
– At the end, the possibility of entering digital data (population numbers and building height) was discussed through which equations are made to calculate the built up area, population density, and calculate the efficiency of services for the population. Then, what was studied in the workshop was applied to buildings from Mansoura University with the help of lecturers.
– The workshop dealt with the definition and discussion about QGIS. In the beginning, the discussion took place about the function of the program to record all the data that related to the city from the streets and buildings (educational, health, residential, ….), and made it available on the Internet and therefore can be consulted at any time.
– After that, the discussion was about the possibility of entering geographic information using Google Earth in the form (maps, aerial photographs, satellite images, descriptive information (names and tables)) and processing this information, storage, analysis (spatial analysis and statistical analysis) and then presented it in the form of Maps, Reports and Charts.
– Then, it was practically experimented with the help of lecturers by identifying a study area on Google Earth and inserting it on QGIS, then drawing the existing buildings with polygons above them to be used to extract maps showing mass, space, movement paths in the study area and other maps showing population density and Others.
– At the end, the possibility of entering digital data (population numbers and building height) was discussed through which equations are made to calculate the built up area, population density, and calculate the efficiency of services for the population. Then, what was studied in the workshop was applied to buildings from Mansoura University with the help of lecturers.